There Are Probably Only 20 Themes



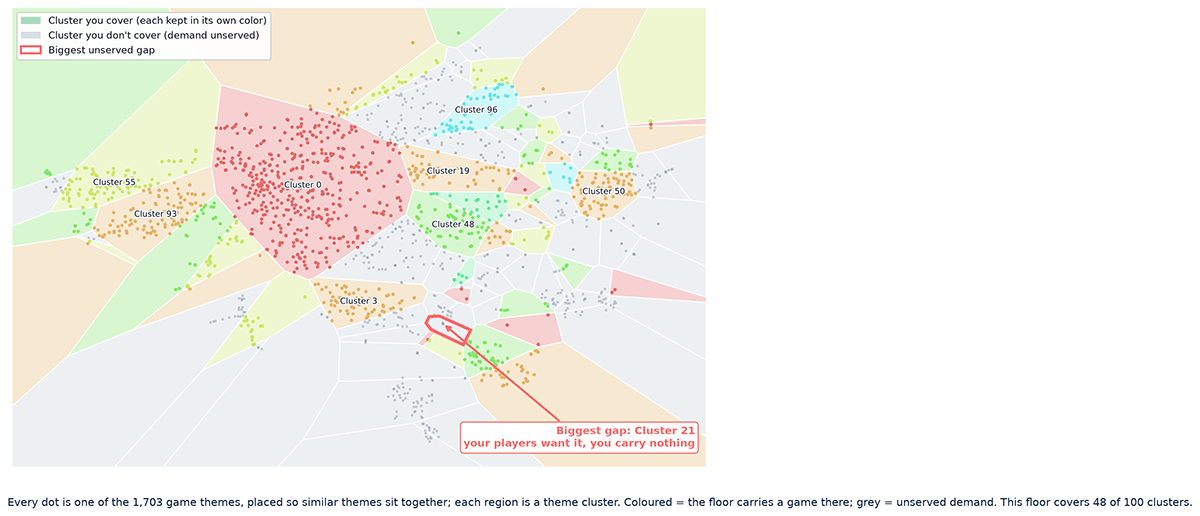
distinct game themes in the model players’ behavior behind itl of a player’s play sits in one cluster Casino floors today feature thousands of distinct slot titles: dragons, diamonds, buffalo, ancient gods, celebrities, holidays. The variety feels endless. But when you analyze how millions of players actually spend their money across all of those games, most of that variety turns out to be cosmetic. Strip away the surface art and branding, and you are left with a small handful of distinct theme clusters that players respond to differently. The same pattern shows up again and again when we apply machine learning to real player behavior at scale, and it has direct consequences for how you predict performance, manage your floor, and talk to your guests. Theme clusters power four things that land straight on your P&L: Place a pitched title in its cluster, then read how your players have spent on that cluster. A grounded forecast before you commit floor space. ↓ See which existing titles a new game pulls from, and whether it steals from your owned machines or your leased ones. The second-order hit, quantified. ↓ Map your floor onto every cluster, spot the player demand you do not serve, and rank those gaps by what they are worth. ↓ Suggest the next title from inside a player’s own cluster, matched by behavior rather than by artwork. To see why clusters matter, start with how we represent a single theme. For every game on your floor we build a theme vector: a numerical fingerprint, 25 numbers long, that captures two things at once. Which players are drawn to it, and how they spend when they play it. Think of it as a behavioral profile rather than a game description. Two games can look completely different on the surface, one a wolf howling at the moon and the other an ancient-Egyptian dig, yet if the same players gravitate toward both and bet in similar patterns, their theme vectors point in nearly the same direction. That similarity is the signal. It says those two titles are, for practical purposes, the same theme in different clothes. Pull any theme below to see its fingerprint, the games that share it, and what each of the 25 hidden dimensions actually separates. Fig 1. Search any of the 1,703 themes to see its 25-number fingerprint. Click any square to rank the whole floor by that one taste dimension and see which games score highest and lowest on it; nobody defined those axes, the players did. The vectors are learned, not authored. We start with raw behavioral data: every carded session, the coin-in and theoretical win it generated, and the theme it landed on, across 3.7 million players. Arrange all of it into one enormous table with players down the side and themes across the top, and play-and-spend in the cells. That table is almost entirely empty, because most players touch only a handful of themes. Fig 2. The raw material. One row per player, one column per theme, a filled cell wherever that player put money into that theme. Almost every cell is empty, which is exactly the problem matrix factorization is built to solve. We then factor that table. The same family of math behind streaming and e-commerce recommenders decomposes who-plays-what into 25 hidden dimensions shared by players and themes. A theme vector is one column of the result. No one decides that wolves and Norse mythology belong together. The players decide, through behavior, and our job is to listen closely enough to hear it. Fig 3. Matrix factorization compresses 3.7 million players by 1,703 themes into two small factor tables. Every theme’s 25-number vector is one column on the right. Plot thousands of theme vectors together and they do not scatter at random. They group. Games that attract the same kind of player, spending the same way, fall into neighborhoods. We call those neighborhoods theme clusters, and they are the unit that makes the rest of this useful. Some neighborhoods are obvious once you see them. A “Dragon Link” cluster holds Autumn Moon, Golden Century, Panda Magic and Happy & Prosperous; a “Lightning Link” cluster holds Heart Throb, Magic Pearl, Sahara Gold and Tiki Fire; a “Wonder 4” cluster holds Jackpots, Tall Fortunes and Wonder Wheel. Three to five titles each, behaving as one game to the player. The model finds these families on its own, from spend alone, without ever reading a game’s name. How tightly do players actually stay inside one neighborhood? We can measure it. Across every carded player on a real floor, we looked at where each player’s theoretical win landed over roughly two dozen Fig 4. The median player keeps about two-thirds of their theo in a single cluster, and meaningfully touches just 3 of ~24. Players do sample a little, but they orbit one neighborhood. So the intuition that a player who loves one game in a cluster sticks to that cluster is mostly right, with a useful caveat. They are not locked to a single title. They roam a small set of close substitutes and rarely venture far. 77% of players keep the majority of their play inside one cluster. That concentration is what makes prediction, substitution, and recommendation possible. When we say twenty, we do not mean exactly twenty. We mean the number is finite and surprisingly small. The floor presents thousands of choices and behaves like a couple dozen. In practice OPTX models 100 clusters. There is no formula that prints the right number, so we landed on 100 the practical way: by watching cluster quality until the groups were clean and well separated, with enough headroom that genuinely different games never get forced together. It is a judgment call, and 100 is a comfortable, finite ceiling next to 1,703 titles. What those 100 clusters reveal is a floor with two extremes. At one end, 35 clusters contain a single theme — standalone hits like Buffalo, Dancing Drums or House of the Dragon with no real substitute. Treat those as must-have staples. At the other end, the largest neighborhood gathers hundreds of near-interchangeable titles, the kind of games players swap between without noticing. Everything else sits in between. Cluster diagnostics: neither curve dictates a single answer; “about 20” sits within the practical quality band. Cluster size and economic concentration: the largest 20 clusters contain most titles, while player spend remains distributed across more clusters. THE NUMBER IS A JUDGMENT CALL, NOT A FACT One hundred is a working choice, not a hard constant. The right number is more art than science, and it shifts with who plays your floor. A locals casino and a destination resort cluster differently. Think of it as “around 100, give or take,” and let your own player base set the exact figure. Back to the four capabilities, now with the machinery behind them. 1. Predict how a new game will perform before it ships When a vendor pitches a new title, you do not have to guess whether your players will respond. By identifying the cluster it belongs to, we look at how your specific player base has historically spent on that cluster and turn it into a grounded forecast, before you commit the cabinet, the lease, or the prime aisle. 2. Measure cannibalization, including the lease impact When you add a game that sits in the same cluster as one you already run well, you often split revenue rather than grow it. Cluster analysis shows where a new title pulls its play from, weighted by how close each existing theme sits in behavior space. The closer the neighbor, the more play it gives up. A new lease and the games already on the floor it sits closest to, ranked by behavioral similarity. Real cosine neighbors from the production model. The source is what matters. When a new game goes in, we can see what it is stealing from. Here, 88% of this lease’s play would come off machines you already own outright, so you would pay a lease fee to relocate win you were keeping in full. The benign case is the opposite: a lease that mostly reshuffles play among other leased titles you are already paying for. Same cannibalization on paper, very different hit to margin, and the cluster math tells the two apart before you sign. 3. See the gaps worth filling This is the view operators react to most. Take every theme cluster, lay it out as a map, and shade it by your floor. Clusters where you carry at least one game stay colored; you compete there. Clusters where you carry nothing go grey. Each grey region is a slice of your own players’ demand that you do not serve. A new lease and the games already on the floor it sits closest to, ranked by behavioral similarity. Real cosine neighbors from the production model. Not all gaps are equal. A grey cluster that your high-value players keep reaching toward, but that your floor cannot satisfy, is a purchasing decision waiting to happen. Add the right title there and you reach a population you were missing instead of splitting play you already own. When a player’s favorite game is down for service, or you simply want to introduce them to something new, you want to suggest a title they will actually enjoy rather than the nearest open machine. Theme clusters let you do that precisely. Pick any theme and the model returns its closest behavioral neighbors, the games your players treat as interchangeable, alongside how each one performs. Fig. 7. Type a theme to see its closest neighbors by behavior, with each one’s performance index, and click any row to recenter on that game. The same list tells you what to recommend and what to expect cannibalization from. Real cosine neighbors from the production model. ALREADY AN OPTX CUSTOMER? These are not one-off research charts. Current customers can already see their own floor’s coverage map in the OPTX AI Hub, built on their own player data and refreshed as their floor changes. What all of this produces is a living map of your floor, one that reflects what your players actually value and updates as their preferences shift. The thousands of titles do not represent thousands of choices. They represent about twenty, repeated in endless costume. Once you can see those twenty clearly, the hard questions get easier: what to buy, what to pull, what to put where, and what to offer the guest in front of you. Want to know which theme clusters your players reach for, and which ones your floor is missing? We will show you what your own data is already telling you.
There Are Probably Only 20 Themes
Thousands of slot titles. A few dozen patterns that actually move players. Here is how we find them, and what it changes about the way you buy, place, and pitch games.
1,703
3.7M
~70%
Why this matters before the math
Predict before you buy
Measure cannibalization & lease impact
Find the gaps worth filling
Recommend what they’ll play
The Building Block
What is a theme vector?

Under The Hood
How we learn them from behavior

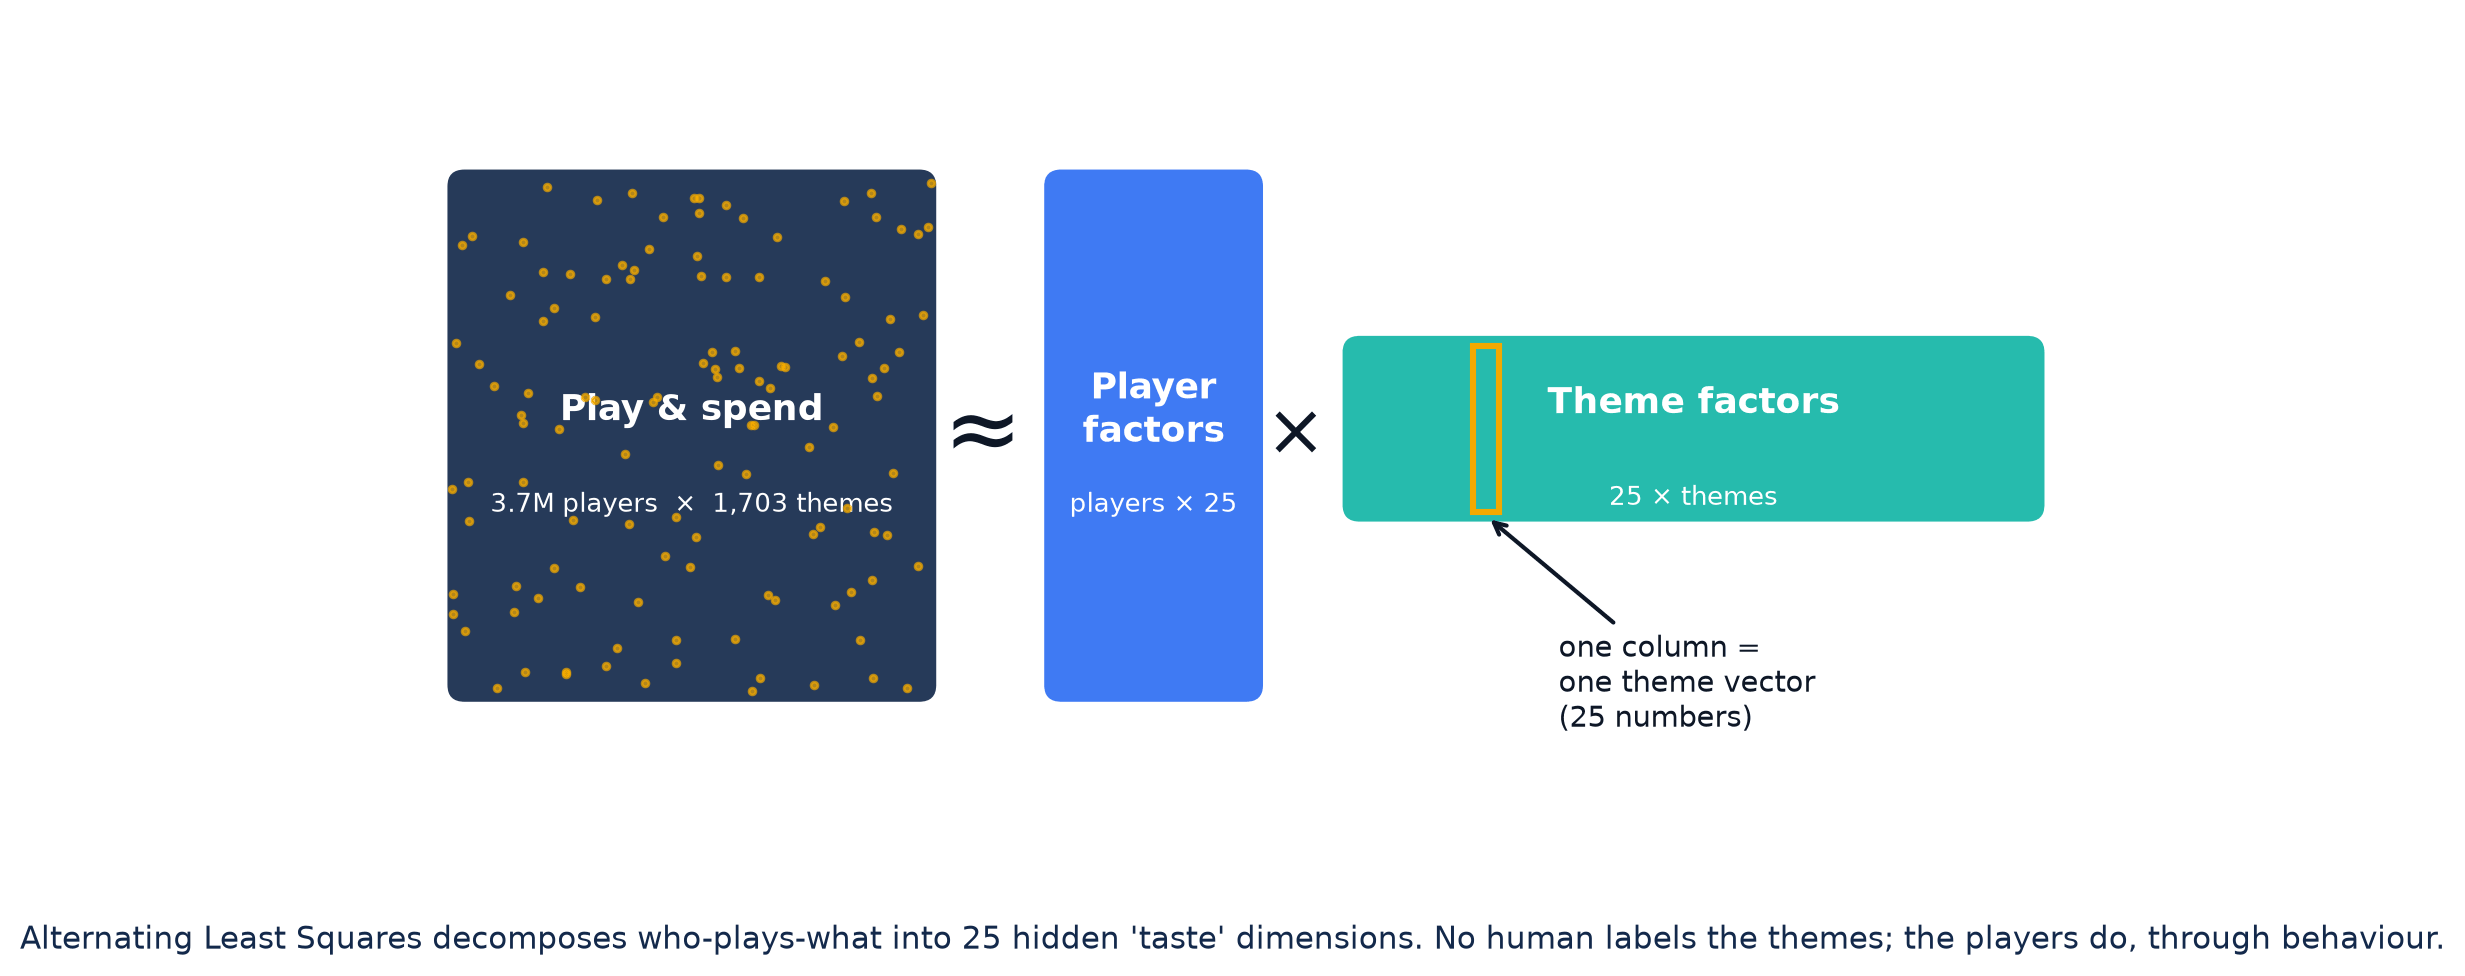
“Two games are the same theme when the same players love them, whatever the artwork says.”
From Vectors to Groups
What is a theme cluster?

The Headline Claim
So how many themes really?


Putting it to Work
What this changes on your floor
Add a New Lease — Lock It Link Night Life — and Here Is Where Its Play Comes From
Closest title already on your floor
Behavioral similarity
Owned / leased
Est. share of its play
Dynamite Dash All Aboard
0.80
Owned
21%
Wicked Wheel Fire Phoenix
0.55
Owned
14%
Wicked Wheel Panda
0.53
Owned
14%
Eureka N More Blastin
0.53
Owned
14%
Huff N More Puff
0.52
Owned
13%
Huff N Lots of Puff
0.49
Owned
13%
Dragon Link Autumn Moon
0.47
Leased
12%
Play that already runs on machines you own outright
—
Owned
88%
4. Make recommendations that actually land

The Takeaway
A living map of your floor
See how your floor maps to the clusters
Book a Demo
Want to know which theme clusters your players reach for, and which ones your floor is missing? We will show you what your own data is already telling you.